SCORE Project
Standardizing Physiological Composite Risk Endpoints (SCORE)
The SCORE Project has a simple goal: help to standardize the creation and use of physiological composite risk endpoints.
As more research studies collect multiple biomarkers, there is an increasing need to "reduce dimensionality" or otherwise summarize related biomarkers into composites, often for use as endpoints, but also as predictors.
The field of psychometrics has long dealt with how to use multiple (potentially noisy) indicators of an underlying construct, like health, or cardio-metabolic risk, or ..., but these techniques are not commonly applied to biological data. Studies that do collect biomarkers and create composites often have slightly different composites, because each study assesses a different set of biomarkers. In psychometrics, standard scales are developed and people tend to use these scales. No such standardized equivalents exist for biomarkers.
The SCORE Project is all about changing this by understanding how biomarkers relate and creating reliable, validated composites that can be used in research or clinical practice.
Metabolic Syndrome
Metabolic syndrome represents a cluster of risk factors for cardiovascular disease and diabetes that frequently co-occur. Metabolic syndrome comprises:
- hypertension (high systolic or diastolic blood pressure)
- elevated triglycerides
- low high-density lipoprotein cholesterol
- hyperglycemia (elevated fasting glucose or glycosylated hemoglobin)
- central obesity (high body mass index or waist circumference)
Metabolic syndrome is defined as the presence of at least 3/5 risk factors, according to guidelines from a joint scientific statement by the International Diabetes Federation Task Force on Epidemiology and Prevention; National Heart, Lung, and Blood Institute; American Heart Association; World Heart Federation; International Atherosclerosis Society; and International Association for the Study of Obesity (Ref).
Clinical thresholds exist for each of the markers. Different units are provided, where appropriate, and alternate markers that are not in the guidelines, but may be used if no other data are available, along with approximately equivalent thresholds.
| Females | Males | |
|---|---|---|
| Waist circumference | ≥ 80 cm (31 in) [~BMI ≥ 25] | ≥ 94 cm (37 in) [~BMI ≥ 25] |
| Triglycerides | ≥ 1.7 mmol/L (150 mg/dL) | ≥ 1.7 mmol/L (150 mg/dL) |
| HDL Cholesterol | < 1.3 mmol/L (50 mg/dL) | < 1.0 mmol/L (40 mg/dL) |
| Hypertension | ≥ 130 mm Hg SBP and/or ≥ 85 mm Hg DBP | ≥ 130 mm Hg SBP and/or ≥ 85 mm Hg DBP |
| Fasting blood glucose | ≥ 5.6 mmol/L (100 mg/dL) [~HbA1c ≥ 5.7] | ≥ 5.6 mmol/L (100 mg/dL) [~HbA1c ≥ 5.7] |
In addition to the dichotomous presence or absence of the metabolic syndrome condition, a metabolic syndrome "severity" or "symptom" score can be created, by combining scores on individual biomarkers into a composite. Advantages of such a composite is that it: 1) contains more information than the simple metabolic syndrome present or absent dichotomy, and 2) is more sensitive to change, which may be particularly important as a risk endpoint in intervention or clinical trial research, and in clinical practice. An individual may improve substantially, even though she or he still meets criteria for metabolic syndrome.
The metabolic syndrome severity score (or MetSSS) can be easily calculated using the cloud-based web app below. This work is based on:
Wiley, J. F. & Carrington, M. J. (in press). A metabolic syndrome severity score: A tool to quantify cardio-metabolic risk factors. Preventive Medicine.
Note that when using this calculator, it is important to specify the sex (Female or Male) for each set of values. Systolic and diastolic blood pressure (SBP and DBP) should be in mm Hg. Triglycerides (Trigs), high density lipoprotein cholesterol (HDL), and blood glucose (glucose) should be in mmol/L. Waist circumference (waist) should be in centimeters.
This chart is a histogram of the MetSSS score in a community sample of adults in regional Australia from the Healthy Hearts Study. MetSSS scores are on the x axis and the frequencies are on the y axis. If you hover over a bar, you will see the midpoint of the bar, the sex, and the frequency.
Allostatic Load
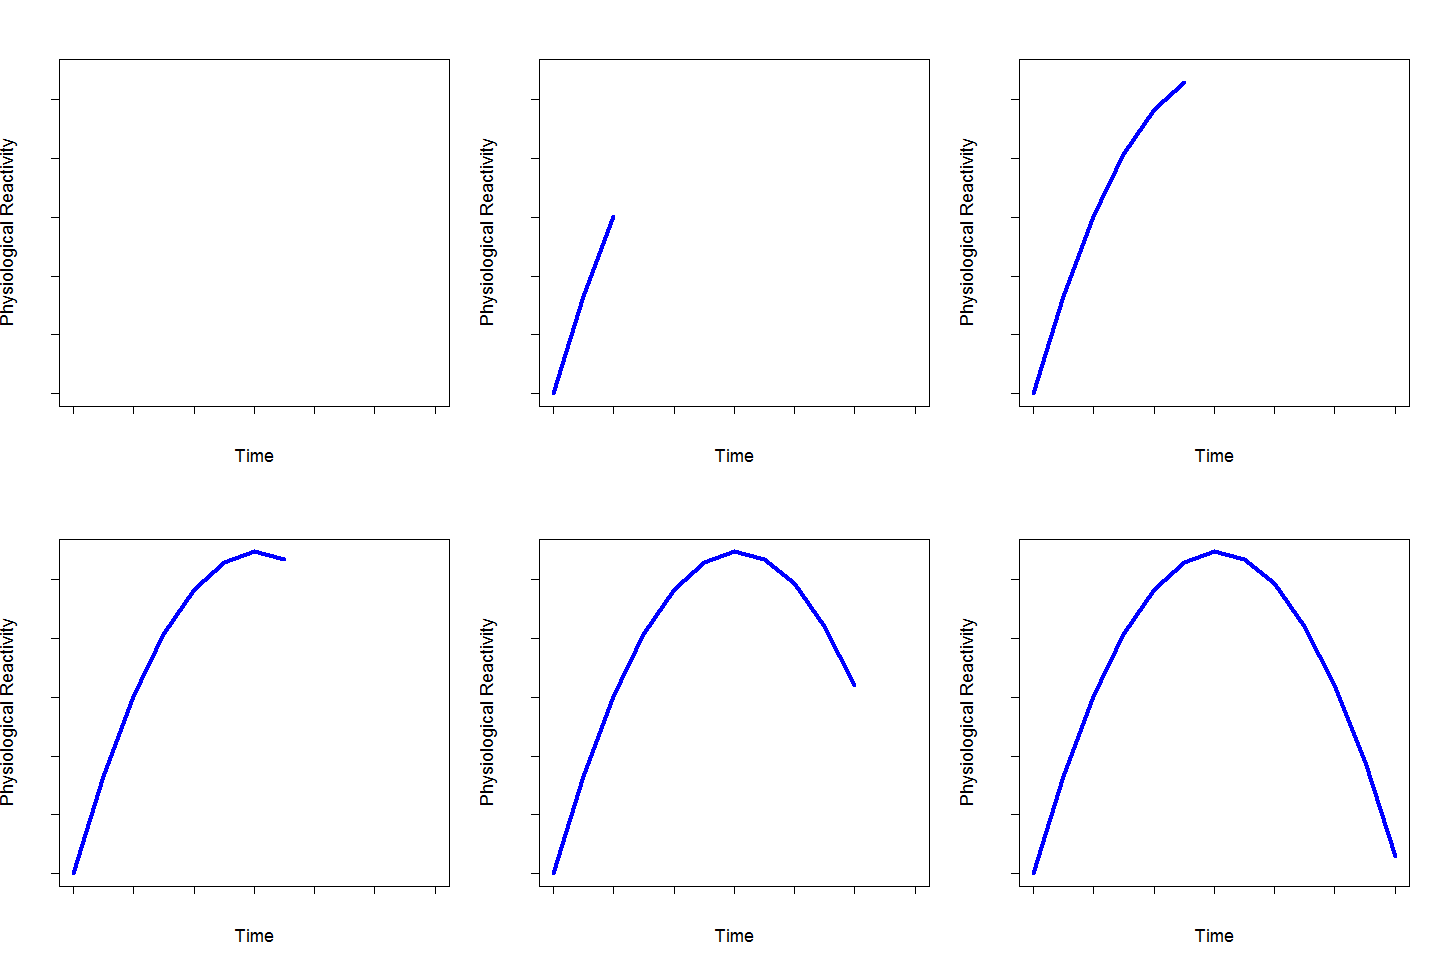
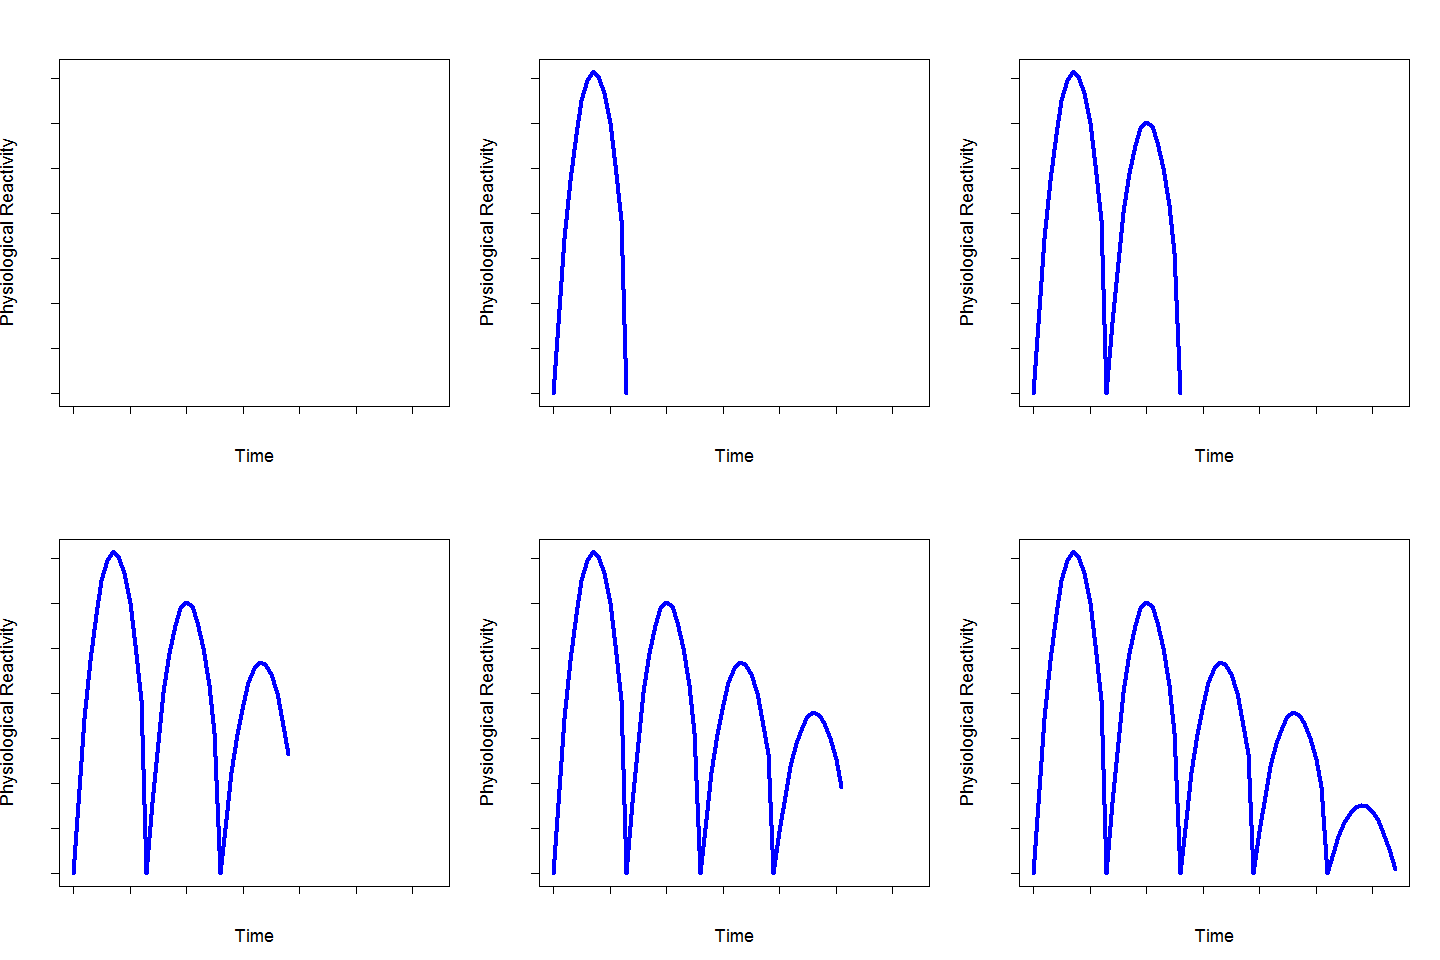
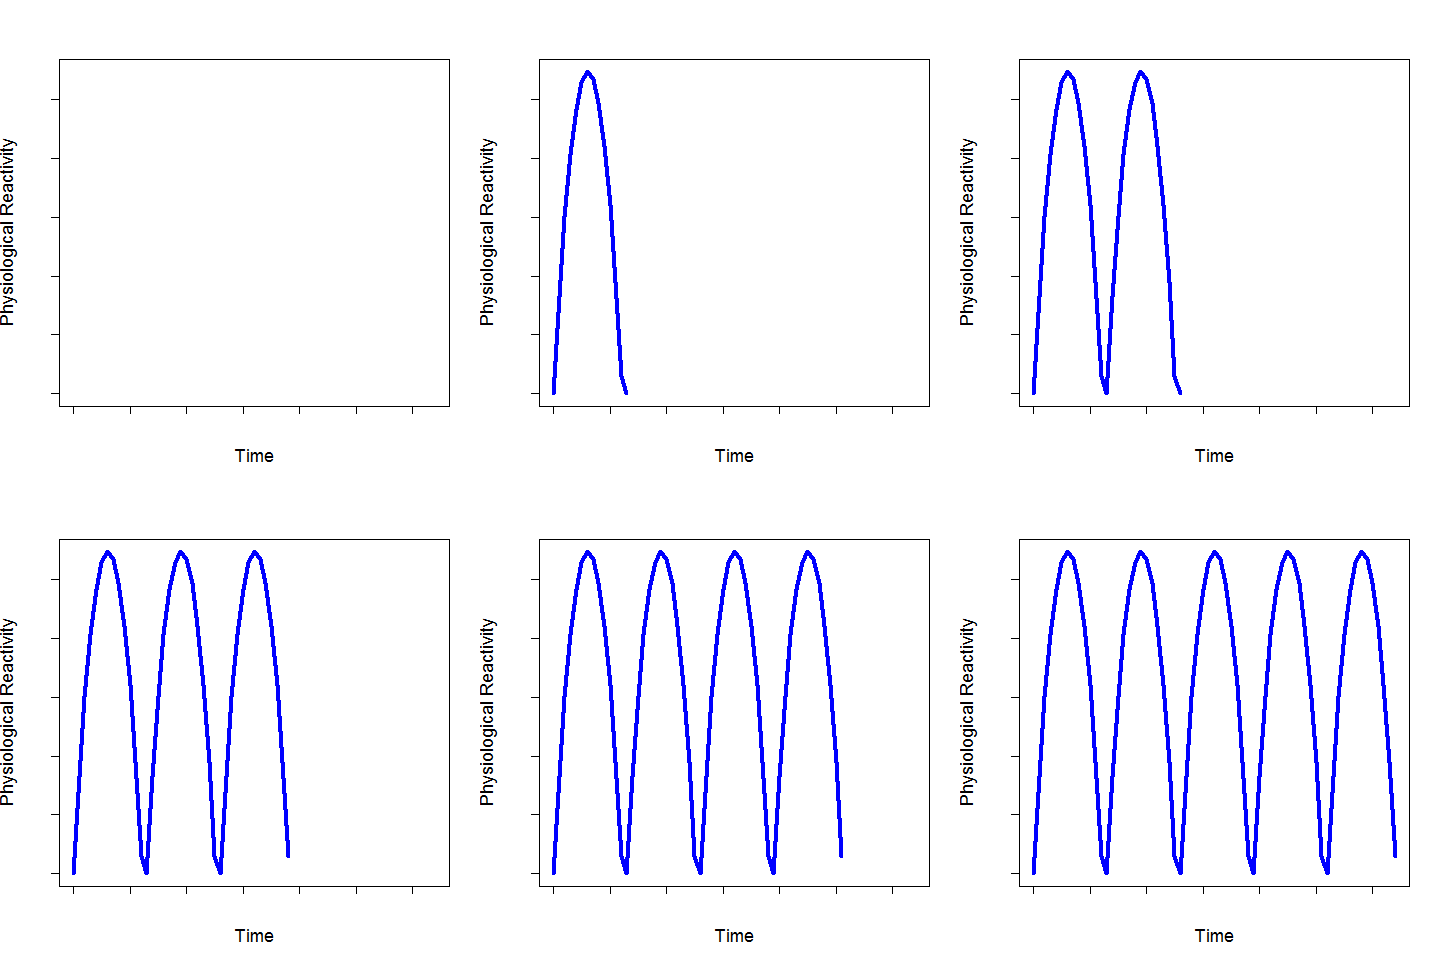
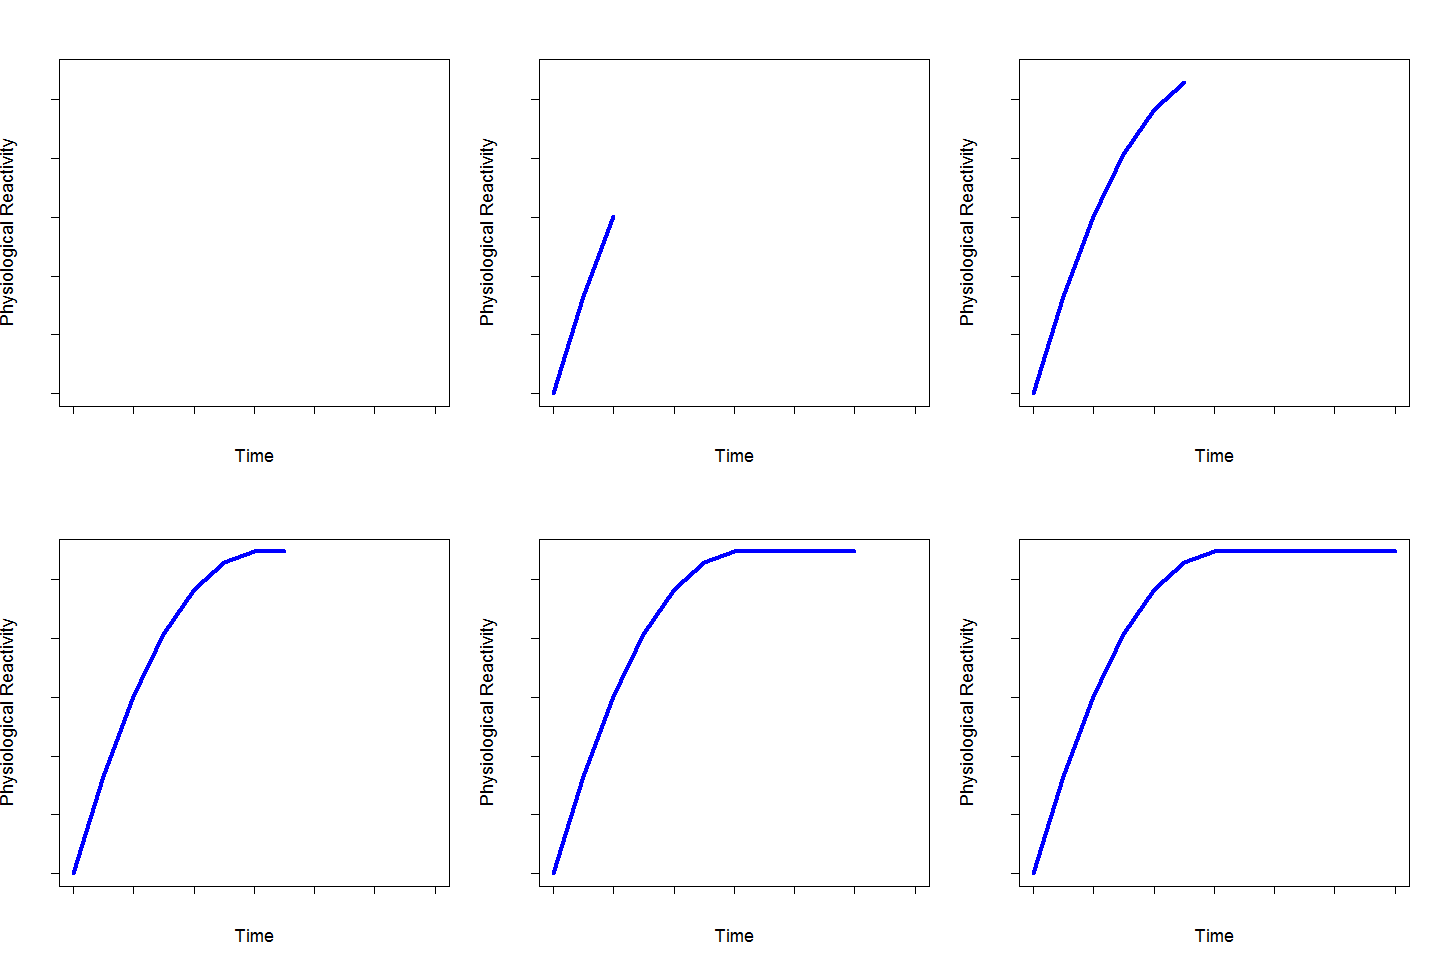
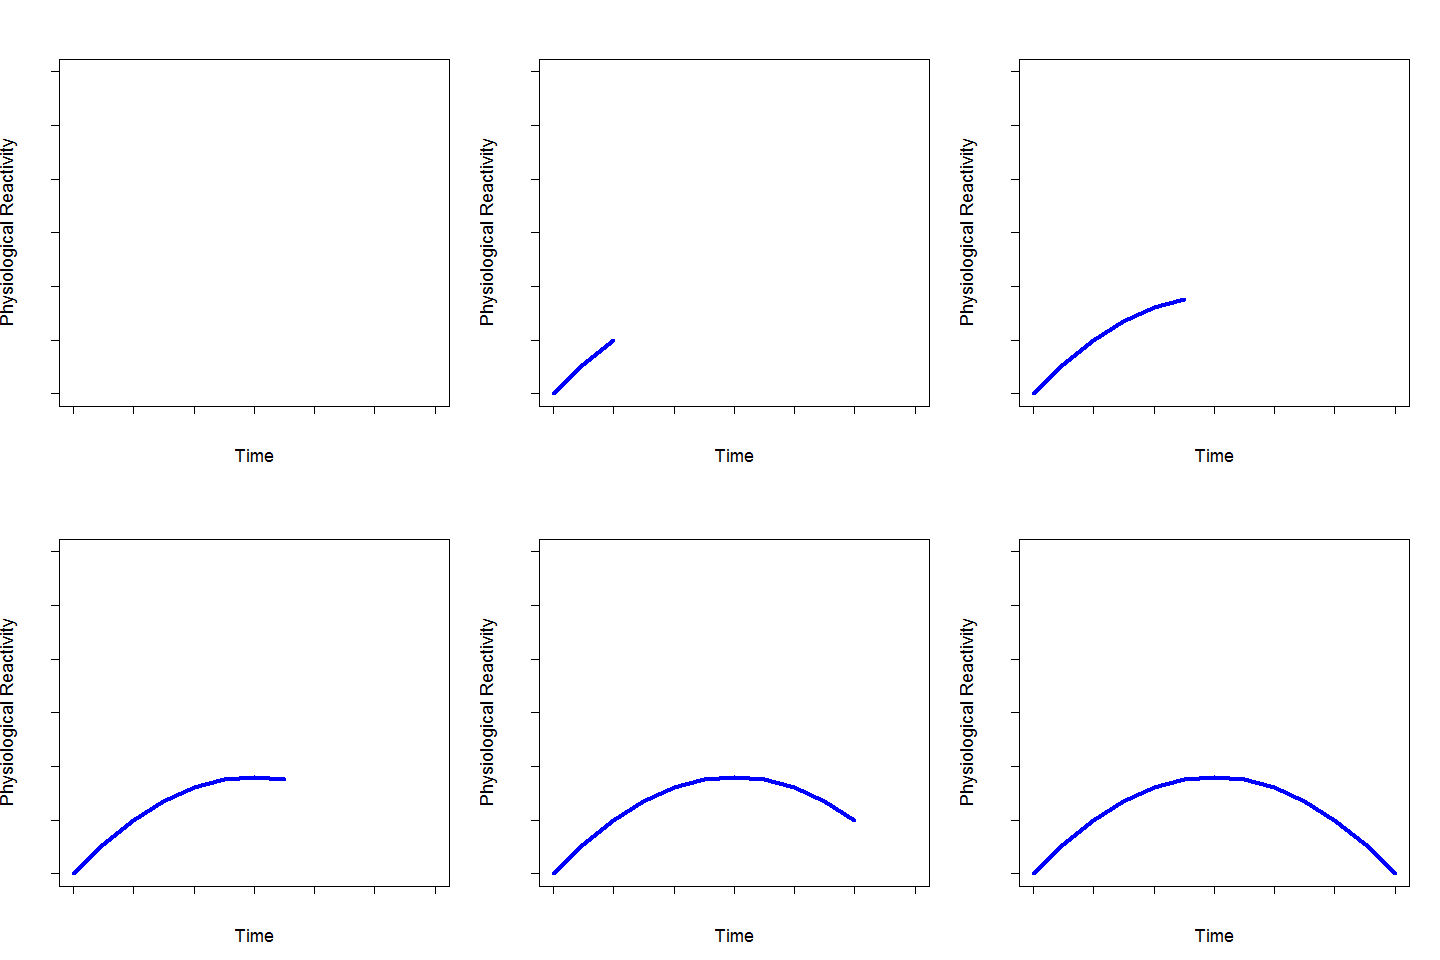
Allostatic load theory posits that repeated activation of the stress response results in wear-and-tear on the body manifested through physiological dysregulation across the entire organism. Examples of a "normal" stress response, healthy adaptation, and then variants of non-optimal physiological stress responses are shown below.
Methods
There are many methods used to create biomarker composites. Examples include:
- sum of biomarkers at or above a "risk" threshold
- sum of standardized biomarker scores (z-score and sum)
- latent factor(s) using factor analysis or structural equation models
- principal component analysis
- Mahalanobis distance (may be either from the mean or other normative values, the mean, or some other threshold)
In addition to each of these approaches to creating a composite, there are a number of additional considerations. For example, when summing the number of biomarkers above a "risk" threshold, which threshold should be used? For some biomarkers, clinical guidelines exist, but for others no standards exist. When using the continuous biomarker scores, should the raw scores be used, or normalizing transformations performed? Also, should the raw scores be used or should the deviations from clinical threshold be used? If deviations are used, should scores "better" than the risk threshold be allowed, or only scores beyond the risk level be used? Is it only values that are "too high" that are problematic or can biomarkers be too extreme in either direction, high or low?
These are just some of the methodological decisions faced. Rather than leave these as subjective decisions, the SCORE Project aims to systematically evaluate different approaches, and provide empirical evidence to guide researchers and clinicians in making these decisions, as well as tools to facilitate creating the composite from whatever the decision.
Publications
Wiley, J. F., Gruenewald, T., Karlamangla, A. & Seeman, T. E. (2016). Modeling Multisystem Physiological Dysregulation. Psychosomatic Medicine, 78(3), 290-301. doi:10.1097/PSY.0000000000000288.
Wiley, J. F. & Carrington, M. J. (in press). A metabolic syndrome severity score: A tool to quantify cardio-metabolic risk factors. Preventive Medicine.
Mplus input scripts to run the primary models from Wiley, Gruenewald, Karlamangla, & Seeman (in press), as well as the Monte Carlo power simulation, and the item parameter invariance models are available online here.
Software
There is an R package called pscore to assist with the scoring and
creation of composites from biomarkers, available from this same GitHub repository.
If you'd like to install the pscore package you can get the latest development version from GitHub or install the latest released version from CRAN using the code below.
	# uncomment line below if devtools package not available
	# install.packages("devtools")
	library(devtools)
	install_github("JWiley/score-project/pscore") # latest development

	# From CRAN
	install.packages("pscore") # latest release
Currently, the package is focused on metabolic syndrome, but more will be coming soon to support scoring allostatic load. Future work also aims to facilitate building/testing different scoring models, as well as getting predictions on new data from existing models.